Background[]
Entity relationship diagrams are abstractions of the real world which simplify the problem to be solved while retaining its essential features. They are used to identify the data that must be captured, stored and retrieved in order to support the business activities performed by an organization. They also identify the data required to derive and report on the performance measures that an organization should be monitoring. The introduction of relational databases sparked a need for more complex database structures and design tools. The ER model was developed by Peter Chen in 1976. Dr. Chen is currently a distinguished chair professor of computer science at Louisiana State University. Click to see - His web site. His paper, “The Entity-Relationship Model--Toward a Unified View of Data”, is one of the most cited and influential papers in computer science.
E/R Modeling[]
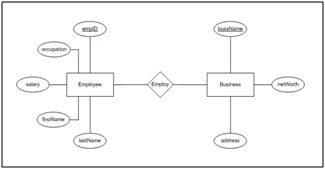
Example ER Model
The Entity-Relationship model is a type of semantic model. A semantic model is a model that is used to describe the external, or conceptual, levels of data. In essence, an ER model shows what a database would look like on the outside, disregarding the internal and physical aspects of the database. Additionally, ER diagrams attempt to incorporate meaning into the data by illustrating the relationship between various objects and attributes.
An ER model contains entities, relationships, and attributes. All of these objects have a specific name and shape to represent them. To start, an entity is a representation of an object in which data is to be collected and stored. They are usually depicted as persons, places, events, objects, or concepts on which we collect data for. An entity is represented by a rectangle in the model. A noun should be used in naming entities. Relationships describe associations among data and between entities. Three possible relationships exist: one-to-one, one-to-many, and many-to-many. Relationships are represented by a diamond in the ER model, and the links in between are represented by lines. Finally, attributes are the data elements that are meaningful to each specific entity. They are what distinguish one entity from another. Attributes are represented by an oval in the model, which branch off of the entities. Additionally, if an attribute's name is underlined, then this means it is the primary key of the entity.
ER diagrams provide a visual representation of data that programmers, designers, and end users can understand. This allows a communication channel to be open between these people in developing a system that will achieve an organization’s needs. People in general can operate more efficiently in a graphical environment. Hence, ER models provide a much better logical view of data than in a file system. As database designs become more complex, the ER model can better handle the entities and relationships associated with it.
Conceptual E/R Diagrams[]
Entity Relationship diagrams, or better known as E/R diagrams, are diagrams that are made to give an overview of a certain database. It is basically a design that shows the “broad” view of a given database. These diagrams are composed of entities, relationships, and attributes. Entities are information that are collected and stored. Relationships are what are seen running between two entities that connect the two. They are drawn using a line to connect everything that is associated together. Attributes are specific data related to certain entities. Though they are not required in an E/R diagram, they give a better understanding and a deeper look into what the database consists of. When looking into the relationship aspect of E/R diagrams, there are three different ways that relationships can be drawn out.
|Teacher|------<Teaches>------|Class|
This relationship is a one-to-one (1:1) relationship. There is exactly one teacher for the class, and the class has exactly one teacher.
|School|>------<Belongs to>------|District|
This relationship is a one-to-many (1:M) relationship. Each school belongs to exactly one district, and each district has one or many schools.
|Teacher|>------<Teaches at>------<|School|
This relationship is a many-to-many (M:N) relationship. Each teacher teaches at one or many schools, and each school has one or many teachers.
These are the three examples of relationships that are drawn out. When all of the entities are put together and drawn out, it will be a much more extensive drawing. Though these are just the basics of an E/R diagram, they are the extremely important aspects in starting a diagram. Entity Relationship diagrams are very important and useful in working with databases. They are made so others like programmers, designers, and users can understand a database approach without having to research into it quite as much.
References[]
Ricardo, Catherine. "Databases Illuminated, 2nd ed." Jones & Bartlett Learning, LLC. Sudbury, MA: 2012.